The EPA has certified this vehicle as among the 20 percent lowest-emitting passenger vehicles for its model year, based on government greenhouse gas and smog ratings.
The EPA has certified this vehicle as among the 20 percent lowest-emitting passenger vehicles for its model year, based on government greenhouse gas and smog ratings.
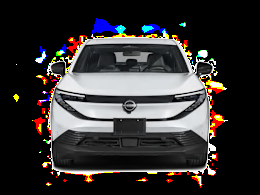
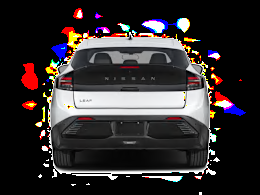
Nissan Leaf
EPA Range:
288 miles
EPA Range:
288 miles
RECALL ALERT:
There is 1 recall on this vehicle.
Learn More.
There is 1 recall on this vehicle.
Learn More.
RECALL ALERT:
There is 1 recall on this vehicle.
Learn More.
There is 1 recall on this vehicle.
Learn More.
Reliability
Predicted Reliability
We expect the 2026 Leaf to have about average reliability when compared to other new cars. This prediction is based on Nissan's brand history and the previous generation of the Leaf.
The 2026 Nissan Leaf has been recalled 1 time by NHTSA.
View Recalls
The 2026 Nissan Leaf has been recalled 1 time by NHTSA.
View Recalls
New Models Predicted Reliability
This Car
0
100
0 - 100
Nissan Leaf
Nissan Leaf
NA
vs. Similar Cars
Fiat 500e
Fiat 500e
Hyundai Ioniq 6
Hyundai Ioniq 6
Hyundai Kona Elec...
Hyundai Kona Electric
Kia Niro Electric
Kia Niro Electric
Tesla Model 3
Tesla Model 3
Nissan vs. Other New Car Brands Reliability
Reliability History
*
Redesign year
Overall Reliability Verdict
NA
POTENTIAL TROUBLE SPOTS
Electric Motor
NA
NA
NA
NA
NA
NA
NA
NA
NA
EV Battery
NA
NA
NA
NA
NA
NA
NA
NA
NA
EV Charging
NA
NA
NA
NA
NA
NA
NA
NA
NA
Drive System
NA
NA
NA
NA
NA
NA
NA
NA
NA
Suspension/Steering
NA
NA
NA
NA
NA
NA
NA
NA
NA
Brakes
NA
NA
NA
NA
NA
NA
NA
NA
NA
Climate System
NA
NA
NA
NA
NA
NA
NA
NA
NA
Electrical Accessories
NA
NA
NA
NA
NA
NA
NA
NA
NA
Body Hardware
NA
NA
NA
NA
NA
NA
NA
NA
NA
Paint/Trim
NA
NA
NA
NA
NA
NA
NA
NA
NA
Noises/Leaks
NA
NA
NA
NA
NA
NA
NA
NA
NA
In-car Electronics
NA
NA
NA
NA
NA
NA
NA
NA
NA
Overall Reliability Verdict
Potential Trouble Spots
2000
2001
2002
2003
2004
2005
2006
2007
2008
2009
2010
2011*
NA
2012
2013
2014
2015
2016
2017
2018*
2019
2020
2021
2022
2023
2024
2025
Powertrain
2000
2001
2002
2003
2004
2005
2006
2007
2008
2009
2010
2011*
NA
2012
NA
2013
NA
2014
NA
2015
2016
NA
2017
NA
2018*
2019
2020
2021
NA
2022
2023
2024
NA
2025
NA
Electric Motor
2000
2001
2002
2003
2004
2005
2006
2007
2008
2009
2010
2011*
NA
2012
NA
2013
NA
2014
NA
2015
2016
NA
2017
NA
2018*
2019
2020
2021
NA
2022
2023
2024
NA
2025
NA
EV Battery
2000
2001
2002
2003
2004
2005
2006
2007
2008
2009
2010
2011*
NA
2012
NA
2013
NA
2014
NA
2015
2016
NA
2017
NA
2018*
2019
2020
2021
NA
2022
2023
2024
NA
2025
NA
EV Charging
2000
2001
2002
2003
2004
2005
2006
2007
2008
2009
2010
2011*
NA
2012
NA
2013
NA
2014
NA
2015
2016
NA
2017
NA
2018*
2019
2020
2021
NA
2022
2023
2024
NA
2025
NA
Drive System
2000
2001
2002
2003
2004
2005
2006
2007
2008
2009
2010
2011*
NA
2012
NA
2013
NA
2014
NA
2015
2016
NA
2017
NA
2018*
2019
2020
2021
NA
2022
2023
2024
NA
2025
NA
Show all Powertrain Trouble Spots
Suspension/Steering
2000
2001
2002
2003
2004
2005
2006
2007
2008
2009
2010
2011*
NA
2012
NA
2013
NA
2014
NA
2015
2016
NA
2017
NA
2018*
2019
2020
2021
NA
2022
2023
2024
NA
2025
NA
Brakes
2000
2001
2002
2003
2004
2005
2006
2007
2008
2009
2010
2011*
NA
2012
NA
2013
NA
2014
NA
2015
2016
NA
2017
NA
2018*
2019
2020
2021
NA
2022
2023
2024
NA
2025
NA
Climate System
2000
2001
2002
2003
2004
2005
2006
2007
2008
2009
2010
2011*
NA
2012
NA
2013
NA
2014
NA
2015
2016
NA
2017
NA
2018*
2019
2020
2021
NA
2022
2023
2024
NA
2025
NA
Build Quality
2000
2001
2002
2003
2004
2005
2006
2007
2008
2009
2010
2011*
NA
2012
NA
2013
NA
2014
NA
2015
2016
NA
2017
NA
2018*
2019
2020
2021
NA
2022
2023
2024
NA
2025
NA
Electrical Accessories
2000
2001
2002
2003
2004
2005
2006
2007
2008
2009
2010
2011*
NA
2012
NA
2013
NA
2014
NA
2015
2016
NA
2017
NA
2018*
2019
2020
2021
NA
2022
2023
2024
NA
2025
NA
Body Hardware
2000
2001
2002
2003
2004
2005
2006
2007
2008
2009
2010
2011*
NA
2012
NA
2013
NA
2014
NA
2015
2016
NA
2017
NA
2018*
2019
2020
2021
NA
2022
2023
2024
NA
2025
NA
Paint/Trim
2000
2001
2002
2003
2004
2005
2006
2007
2008
2009
2010
2011*
NA
2012
NA
2013
NA
2014
NA
2015
2016
NA
2017
NA
2018*
2019
2020
2021
NA
2022
2023
2024
NA
2025
NA
Noises/Leaks
2000
2001
2002
2003
2004
2005
2006
2007
2008
2009
2010
2011*
NA
2012
NA
2013
NA
2014
NA
2015
2016
NA
2017
NA
2018*
2019
2020
2021
NA
2022
2023
2024
NA
2025
NA
Show all Build Quality Trouble Spots
In-car Electronics
2000
2001
2002
2003
2004
2005
2006
2007
2008
2009
2010
2011*
NA
2012
NA
2013
NA
2014
NA
2015
2016
NA
2017
NA
2018*
2019
2020
2021
NA
2022
2023
2024
NA
2025
NA
Reliability indicates how models have performed in the past, providing the basis for predicting
how the vehicles will hold up in the year ahead. These charts provide the most comprehensive reliability
information available to consumers. Based on information received from our latest subscriber survey for
about 380,000 vehicles, our reliability history charts give
you a rundown on how 2000 through 2025 vehicles are holding up in 20 potential
trouble spots, ranging from the engine, transmission, electric motor, EV charging, and brakes,
to power equipment and the electrical accessories.
Recalls
PROVIDED BY

ELECTRICAL SYSTEM
Mar 25, 2026
A short circuit in a high voltage battery module increases the risk of a fire.
Summary:
Nissan North America, Inc. (Nissan) is recalling certain 2026 LEAF vehicles. The high voltage battery may have internal damage that can cause a short circuit within the battery module.
What should you do:
Owners are advised to park outside and away from structures and should not charge their vehicles until the remedy is completed. Dealers will replace the battery modules or the battery, free of charge. Interim letters notifying owners of the safety risk are expected to be mailed April 17, 2026. Additional letters will be sent once the final remedy is available, anticipated in July 2026. Owners may contact Nissan's customer service at 800-647-7261. Nissan's number for this recall is R25F1. Vehicle Identification Numbers (VINs) involved in this recall became searchable on NHTSA.gov on March 27, 2026.
For more information:
NHTSA CAMPAIGN ID Number:
26V188000
Potential Number of Units Affected:
51
Check Vehicle for Unrepaired Recalls
Enter a valid 17-character VIN
Enter a valid 17-character VIN