Why the Fuel Cost Estimates on Car Window Stickers Are So Inaccurate
Car buyers need to check online to get accurate fuel costs because window sticker projections are two years out of date
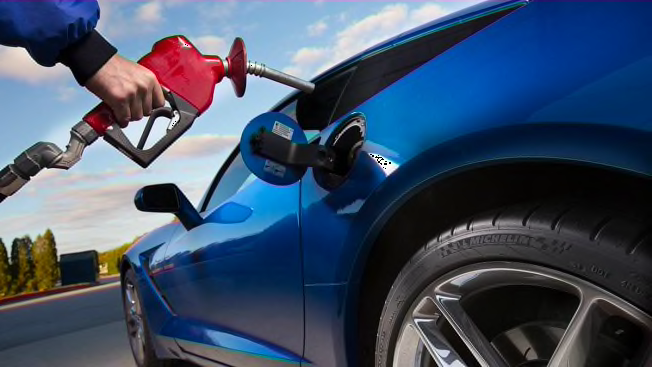
As gas prices soared in 2022, it was clear that the fuel cost estimates printed on new-car window stickers weren’t keeping pace, putting shoppers at a disadvantage when researching models at a dealership. In fact, the one- and five-year projected fuel costs that are required to be printed on every sticker are generally two years out of date.
The national average price for a gallon of regular gas has hovered around $4 this week, up from about $3 a year ago, according to AAA. Because of the price surge, we’ve found some projected fuel costs over five years to be off by thousands of dollars for some vehicles we’ve purchased for our test program. (See specific examples, below.)
The printed window sticker estimates are so out of whack because fuel costs used in the calculations are provided two years in advance to automakers by the Environmental Protection Agency. This means the figures for the 2023 model year were compiled in November 2021 and sent to automakers in December 2021, according to an EPA spokesperson. The stickers also use the price for regular gas, even when a model calls for more expensive premium fuel.
To get the most accurate information at the dealership, car buyers need to use their smartphone to access a QR code, which is also printed on each window sticker; it provides direct digital access to more accurate market information. Photographing that code opens fueleconomy.gov—the official government source for fuel-economy information run by the EPA and Department of Energy. The site provides near-current fuel pricing, updated weekly, and an interactive calculator that can be used to predict future costs based on a gas price and vehicle fuel economy.
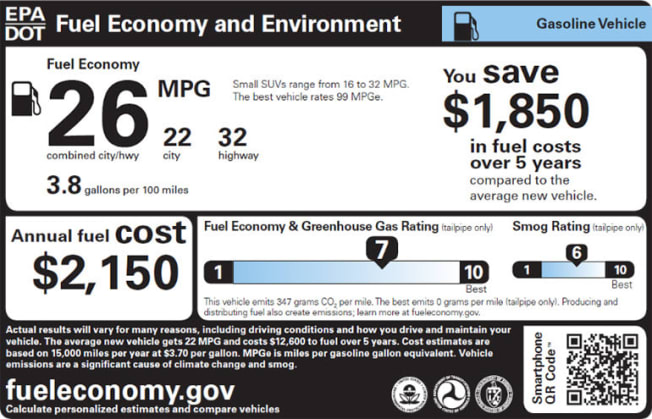
Illustration: EPA Illustration: EPA
Comparing Our Window Stickers With Reality
We found significant differences in the estimated costs presented on the window stickers from our recently tested cars compared with what owners will really face right now. Below we break down three examples from cars bought within the past month and explain how the figures are generated.
For the sticker, the EPA assumes a car is driven 15,000 miles, and the calculation is based on its combined miles-per-gallon rating, merging city and highway test results. The average miles used in the comparison found in the small print on each label are based on the vehicles for that model year, using a specific gas price.
For the 2022 models, the window stickers state that the average new car gets 27 mpg and costs $6,500 over five years. The 2022 cars cited below use $2.35 price per gallon, despite the fact that the Subaru WRX uses more expensive premium gas.
By contrast, the window sticker for our 2023 Acura Integra says the average new car gets 28 mpg and costs $8,000 over five years based on $3.65 per gallon.
For our calculations below, we rounded the current national gas price averages to $4 a gallon for regular and $4.70 for premium. The calculations were then rounded.
2022 Ford Maverick
EPA’s combined fuel economy: 37 mpg on regular
EPA’s estimated annual fuel cost: $950
EPA’s estimated five-year fuel cost: $4,765
CR’s estimated annual cost at $4 per gallon: $1,620
CR’s estimated five-year cost at $4 per gallon: $8,110
Five-year difference in window sticker vs. reality: $3,350
2022 Subaru WRX
EPA’s combined fuel economy: 22 mpg on premium
EPA’s estimated annual fuel cost: $1,600
EPA’s estimated five-year fuel cost: $8,010
CR’s estimated annual cost at $4.70 per gallon: $3,200
CR’s estimated five-year cost at $4.70 per gallon: $16,020
Five-year difference in window sticker vs. reality: $8,010
2023 Acura Integra
EPA’s combined fuel economy: 32 mpg on premium
EPA’s estimated annual fuel cost: $1,700
EPA’s estimated five-year fuel cost: $8,500
CR’s estimated annual cost at $4.70 per gallon: $2,200
CR’s estimated five-year cost at $4.70 per gallon: $11,020
Five-year difference in window sticker vs. reality: $2,460
When fuel prices are relatively stable, these labels are a great resource. We saw a dramatic difference in the estimates when prices climbed to $5 for regular gas, putting the window stickers many thousands of dollars off relevant to real-world, five-year projections.
Consider the lessons of 2022 when shopping for a new car: If gas prices climb, it can have a massive impact on your budget, especially with a less efficient model and/or one that requires premium fuel.
Pro tip: Shoppers should use the QR code on the window sticker or fueleconomy.gov to get timely fuel cost estimates.
Editor’s note: This article has been updated to reflect a drop in gas prices.

