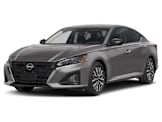
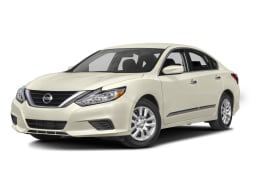
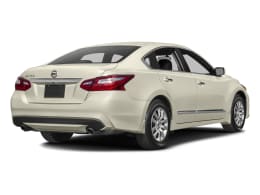
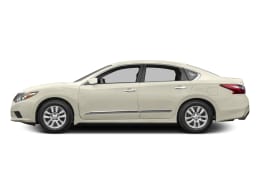
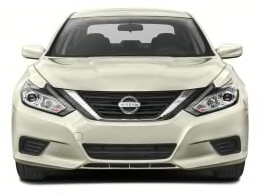
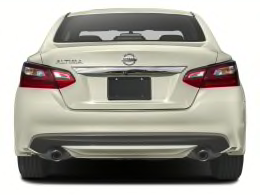
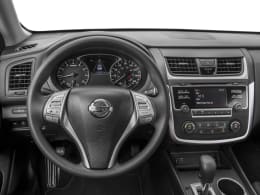
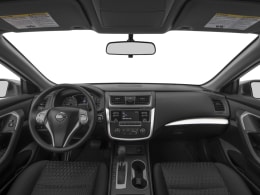
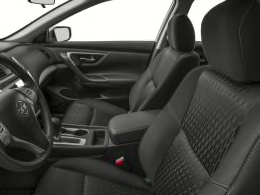
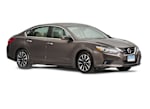
2016
Nissan Altima
EPA MPG:
31 mpg
EPA MPG:
31 mpg
RECALL ALERT:
There are 4 recalls on this vehicle.
Learn More.
Shift your car buying experience
See how your top choices measure up on the features that matter most to you.

2016 Sedans & Hatchbacks Reliability
This Car
0
100
Nissan Altima
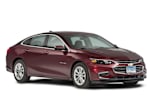
vs. Similar Cars
Chevrolet Malibu
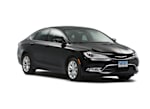
Chrysler 200
Ford Fusion
Honda Accord
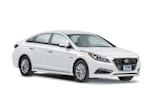
Hyundai Genesis
Crash Tests
IIHS Front Moderate Overlap
IIHS Front Small Overlap, Driver
IIHS Side Crash
NHTSA Overall Crash
NHTSA Overall Frontal-Crash
NHTSA Overall Side-Crash
Crash Tests
IIHS Front Moderate Overlap
IIHS Front Small Overlap, Driver
IIHS Side Crash
NHTSA Overall Crash
NHTSA Overall Frontal-Crash
NHTSA Overall Side-Crash
Nissan vs. Other New Car Brands
Crash Tests
IIHS Front Moderate Overlap
IIHS Front Small Overlap, Driver
IIHS Side Crash
NHTSA Overall Crash
NHTSA Overall Frontal-Crash
NHTSA Overall Side-Crash
Nissan vs. Other New Car Brands
2016 Midsized cars Ratings


Features & Specs
Body Style
sedan
Seating
2 front, 3 rear
Drive Wheels
Front
Engines Available
- 2.5-liter 4 (182 hp)
- 3.5-liter V6 (270 hp)
Transmissions Available
- CVT
Cargo Volume
- Join Consumer Reports cu. ft.
Warranty
Coverage varies among versions of this vehicle
In most cases, automotive warranties are based on the vehicle identification number (VIN), and the warranty will be valid regardless of ownership. The dealership can tell you exactly how much warranty is left.
Read more about extended warranties
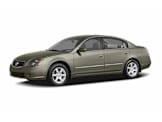
Model History